24.5%
Tyre worn close to the legal limit or worn on the edge
A tyre is worn, cut, damaged or otherwise not fit for the road. Tyres are the only thing connecting the car to the road, so this is always worth taking seriously.

TeslaUsed-car reliability
At 7 years old, the average Tesla fails its MOT more often than the average UK car.
MOT fail rate · 7-year-old cars
Fails more often than the average 7-year-old car (about 1 in 6 MOTs, 16.6%)
Where to start
The Tesla models whose MOT tests at 7 years old most and least often ended in a fail.
Lowest fail rates
 Tesla Model S16.7%fail rate
 Tesla Model X18.8%fail rate
What actually goes wrong
The most common MOT faults across the Tesla range, in plain English. Models with more MOT tests count for more. The percentage is the share of MOT tests on Tesla cars that recorded that defect.
A tyre is worn, cut, damaged or otherwise not fit for the road. Tyres are the only thing connecting the car to the road, so this is always worth taking seriously.
Brake pads or linings are worn, contaminated, or missing. These are the friction materials that press against the disc or drum to slow the car. When too thin, stopping distances increase.
MOT wording: Brake pads wearing thin
A suspension ball joint, pin, or rubber bush is worn or has excessive play. These are the pivot points and flexible mountings that let the suspension move — wear causes knocking sounds and vague steering.
MOT wording: Suspension arm pin or bush worn, but not moving too much
A tyre is worn, cut, damaged or otherwise not fit for the road. Tyres are the only thing connecting the car to the road, so this is always worth taking seriously.
Across all Tesla models; models with more MOT tests count for more.
The whole range
For each model, one number: the share of its MOT tests at 7 years old that ended in a fail. Retests count as tests. Lower is better. The UK average (about 1 in 6 MOTs, 16.6%) is shown for reference. Only models with enough MOT data at 7 years old are ranked. The rest sit just below, unranked.
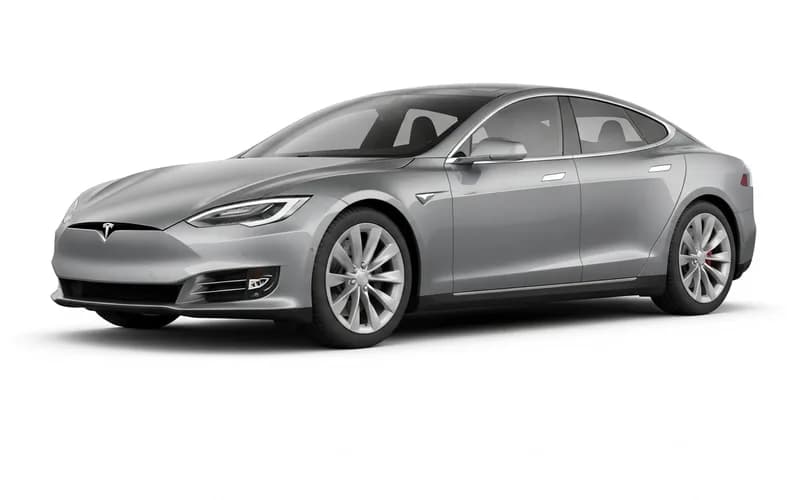
The lowest 7-year fail rate of any Tesla here.

Above the Tesla average, and at or above the UK average.
Fail rates are the share of MOT tests on 7-year-old cars ending in a fail, retests included (DVSA MOT results, 2025). UK average across all makes at the same age: 16.6%. How we count fail rates
Shown unranked. These models don’t have enough MOT data at 7 years old yet. They’re either too new (few cars old enough) or too old (few still on the road). Each is shown at the age with the most tests, so the percentages aren’t directly comparable to the list above.
Averages tell you the odds across the range. Enter a number plate to see that car’s own MOT history, its risk rating, and what’s likely to need attention.