

Chevrolet Matiz build years & generations
The Chevrolet Matiz spans several build years and named generations (2005-2011). Match a build year to its generation, then see how each group of build years does at its MOT.

Which year is which
Build years & generations, side by side
Find the build years you're looking at and see which generation they are. You'll also see which group of build years the MOT figures come from.
Built 2005-2008
- Generation
- M200 (Daewoo Matiz facelift)
- Figures from
- cars built 2005-2008
Counted with this generation only.
Built 2009-2011
- Generation
- M300 (Spark)
- Figures from
- cars built 2009-2012
Counted with this generation only.
“Figures from” is the group of build years behind each card's MOT figures. Years where one generation gave way to the next can sit in a wider group until there's enough history to split them.
By build-year group
How each group of build years performs
Each card shows MOT results for one group of Chevrolet Matiz build years. “Age” means the car's age on the day of its MOT, not its build year. “25+” groups every test on cars aged 25 or older.
Built2009-2012
M300 (Spark) only
These build years are all M300 (Spark), so the figures are almost all from that generation.
Fail rate at 16 years old (latest age)
32.4%
UK average for cars this age: about 3 in 10 (30%)
Ages with data
14 to 16 years old
MOT tests counted
5,034
Chart shows
Age at the MOT
Not the build year
2009-2012
M300 (Spark) only
These build years are all M300 (Spark), so the figures are almost all from that generation.
Fail rate at 16 years old (latest age)
32.4%
UK average for cars this age: about 3 in 10 (30%)
Ages with data
14 to 16 years old
MOT tests counted
5,034
Chart shows
Age at the MOT
Not the build year
Fail rate is the share of MOT tests that ended in a fail. Retests count as tests. How we count fail rates Highest fail rate at 15 years old.
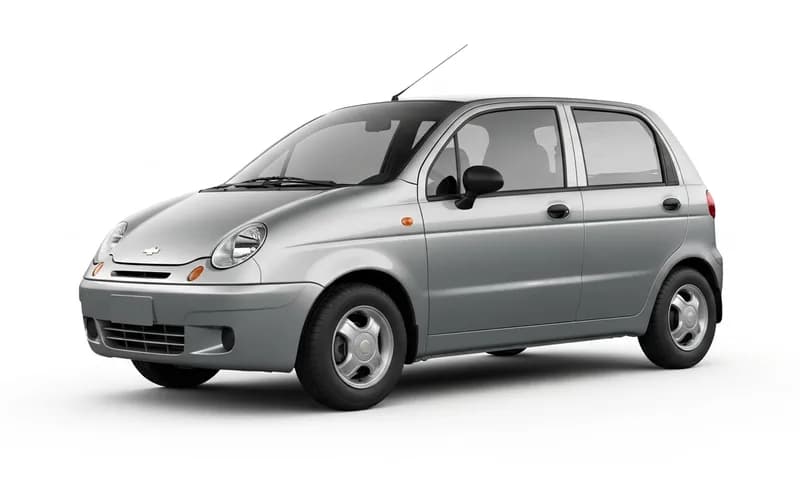 Built
2005-2008
M200 (Daewoo Matiz facelift) only
These build years are all M200 (Daewoo Matiz facelift), so the figures are almost all from that generation.
Fail rate at 20 years old (latest age)
38.9%
UK average for cars this age: about 3 in 10 (30.3%)
Ages with data
16 to 20 years old
MOT tests counted
6,535
Chart shows
Age at the MOT
Not the build year
2005-2008
M200 (Daewoo Matiz facelift) only
These build years are all M200 (Daewoo Matiz facelift), so the figures are almost all from that generation.
Fail rate at 20 years old (latest age)
38.9%
UK average for cars this age: about 3 in 10 (30.3%)
Ages with data
16 to 20 years old
MOT tests counted
6,535
Chart shows
Age at the MOT
Not the build year
Fail rate is the share of MOT tests that ended in a fail. Retests count as tests. How we count fail rates Highest fail rate at 20 years old.